
On a recent engagement for a major digital real estate platform, I was brought in to diagnose a 30% utilization gap* on a premium product. The product was the platform's premium listing enhancement that combines AI-powered virtual staging, interactive floor plans, priority search placement, and agent branding to help sellers present their home through immersive digital media. The signals the company was tracking were convincingly strong. Premium listings sold for ~2% higher price (~$8,300 on a median value home), generated 60% more page views, saves, and shares, delivered 30% more listing appointments, and went pending 20% faster. In a post-NAR market where agents need to justify their commission, the product gave them the strongest pitch available. By those measures, product-market fit looked proven.
But utilization sat at 40% against a 70% target. Activation was declining ~900 basis points year over year. My initial framing was that the product had proven PMF and the commercial model was failing to capture the value. After completing the diagnostic, I revised that conclusion. I found that the product had market fit with only roughly 8% of the addressable market. The packaging, the metering, the pricing, and the go-to-market were all designed for that 8%. The other 92% were never part of the equation.
Two decisions made at the product design stage set the entire cascade in motion. The Product Team unknowingly defined its market as the 8% who already bought. And they shipped a monolithic bundle that forced every agent to buy every feature whether they valued it or not. One error narrowed who could buy. The other narrowed what they could buy. The utilization gap was the predictable result of these decisions cascading through seven sequential misses, each one compounding the one before it.
Strategy before structure. The pricing strategy the platform never defined: incent acquisition and activation at the agent segment level with the right pricing model, packaging construct, and metering while protecting margin. Every miss that follows traces back to the absence of this statement. The full sequence is mapped below.
*Utilization is defined as the percentage of purchased credits activated as live listings within a given period.
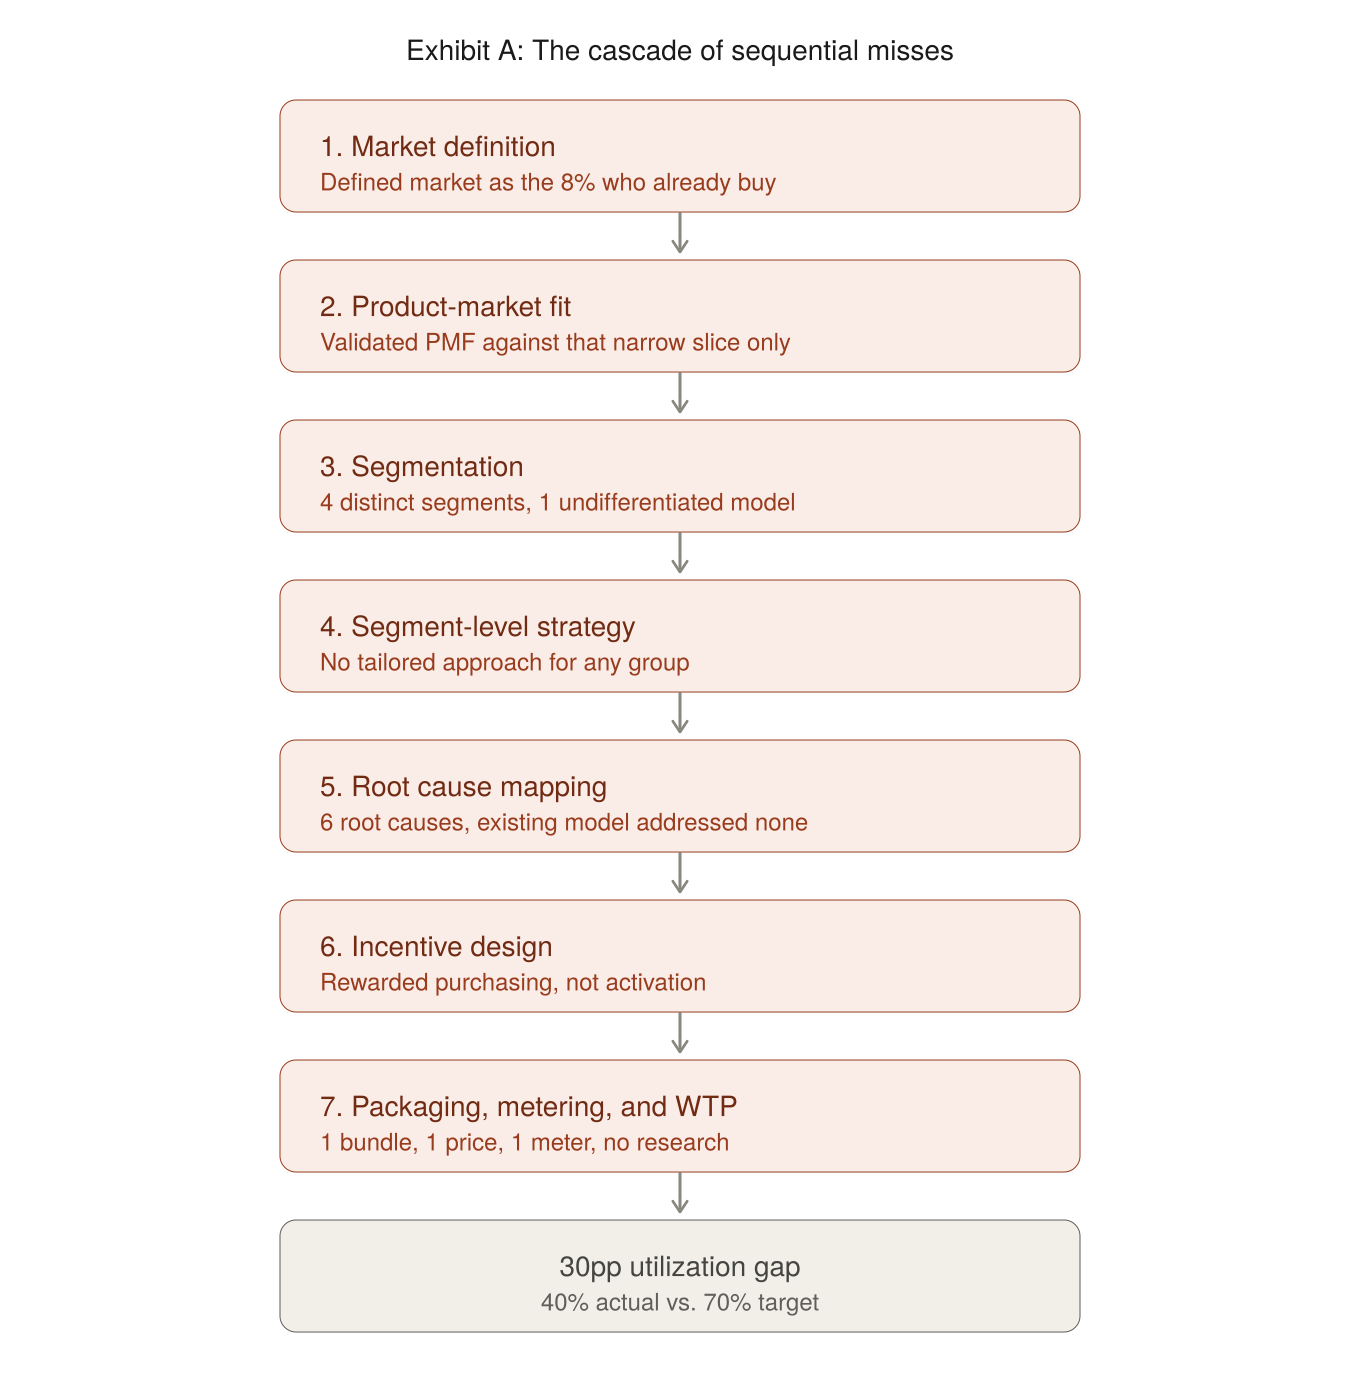
Miss 1: Market Definition
At the product design stage the platform missed the full customer segmentation profile. The platform defined its market for the premium product as the agents who already purchased credits. And that, I found, was roughly only 8% of the platform's agent ecosystem. The commercial model, the discount structure, the packaging, the sales motion — all of it was built around this group. The 92% who had never tried the product weren't treated as an addressable segment. They were invisible. No trial mechanism, no entry ramp, no acquisition strategy. The largest segment in the market didn't have a path to first purchase.
Miss 2: Product-Market Fit Was Validated Against the Wrong Slice
PMF was measured using the behavior of the 8% who were already buying. They had media ready, high listing volume, and the workflow to activate credits immediately. Of course the product performed well for them. But that narrow validation masked a fundamental packaging problem: the product was a monolithic bundle. Every user got every feature whether they valued it or not. An agent who only wanted priority placement or AI-powered staging couldn't buy those capabilities individually. The bundle had fit with power users. It had no fit with the vast majority who might have purchased one or two capabilities at a lower price point if they'd been given the option. PMF was real for a fraction of the market, and the packaging made sure it stayed that way.
Miss 3: Segmentation
With the market defined as "agents who buy credits," there was no segmentation work underneath. But the diagnostic revealed four distinct segments with completely different economics, behaviors, and purchase triggers. Zero-credit agents (92% of the base) had never evaluated the product and faced a negative single-deal ROI on first purchase. Solo and small-team buyers (5–6%, 1–20 credits/month) were purchasing but activating less than 50%. Mid-size teams (2–3%, 21–49 credits/month) were losing credits to per-agent allocation with no redistribution. Enterprise brokerages (<1%, 50+ credits/month) were negotiating custom terms with no structured framework. Four segments, four different problems, and one undifferentiated commercial model trying to serve all of them.
Miss 4: Segment-Level Strategy
Without segmentation, there was no tailored strategy for any group. The zero-credit agents had no acquisition play. Solo buyers had no activation mechanism. Teams had no governance tools. Enterprise accounts had no Deal Desk framework. The entire go-to-market ran on one pricing construct: buy credits at ~$400 each, get volume discounts if you buy more. That construct made sense for the 10% who already bought in bulk. For everyone else, the commercial model offered nothing. No trial to reduce evaluation risk. No subscription to drive recurring behavior. No team pooling to eliminate governance waste. No structured give-get for enterprise negotiations.
Miss 5: Root Cause Mapping
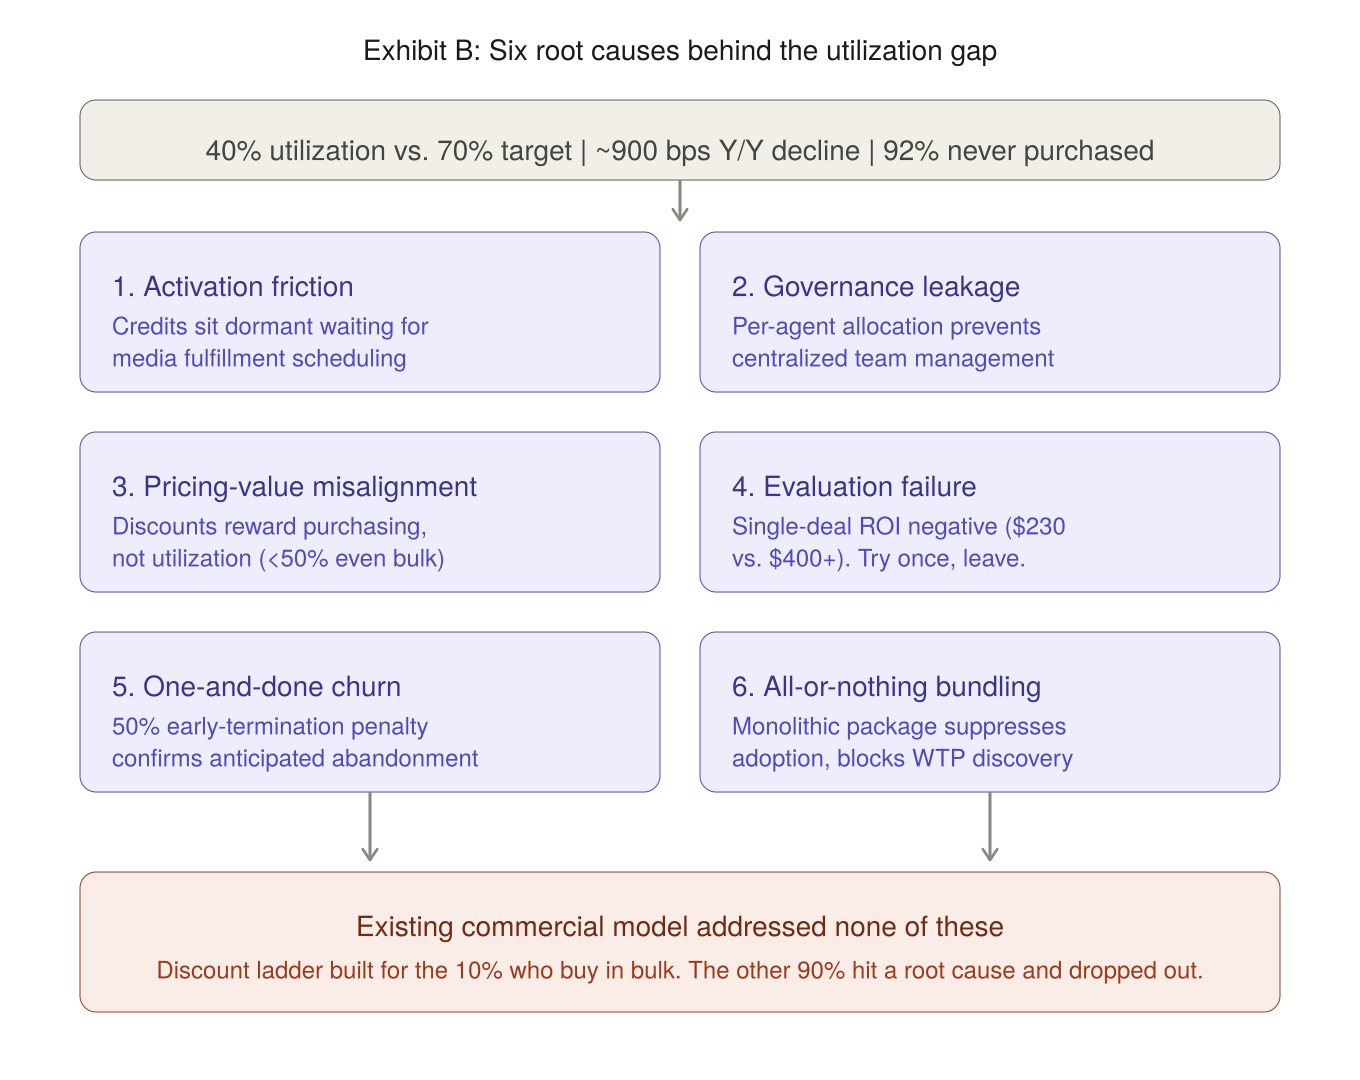
The diagnostic surfaced six root causes behind the utilization gap: activation friction (credits dormant due to fulfillment bottlenecks), governance leakage (per-agent allocation trapping credits), pricing-value misalignment (discounts rewarding purchase volume rather than activation), evaluation failure (single-deal ROI appearing negative at $230 return vs. $400+ cost), one-and-done churn (confirmed by the platform's own 50% early-termination penalty), and all-or-nothing bundling (monolithic packaging suppressing adoption). The existing commercial model addressed none of them. The discount ladder was designed for the 10% who already bought in bulk. The remaining 90% of the addressable market hit one or more of these root causes and dropped out.
The six root causes and their relationship to the existing commercial model are summarized below.
Miss 6: Incentive Design
The pricing model rewarded purchasing, not activation. Buy more credits, get a bigger discount. But even bulk buyers were activating less than 50% of what they purchased. Credits sat dormant. The discount structure had no behavioral forcing function tied to usage. No rebate conditioned on activation thresholds. No forfeiture mechanism that made dormant credits visible as wasted spend. The incentives were aligned to revenue collection, not to the utilization behavior the platform needed to drive.
Miss 7: Packaging, Metering, and Willingness-to-Pay
The product was sold as one bundle at one price with one meter (credits). No Good-Better-Best tiering. No feature gating. No willingness-to-pay research to validate what customers would pay for individual capabilities. Agents who valued only one feature paid the same as agents who used everything. The packaging suppressed adoption by forcing an all-or-nothing decision on a product where different users valued different things. Without WTP data, the platform had no way to know which features drove purchase intent, which drove retention, and which were just along for the ride. Every pricing decision was a guess built on the behavior of the 8% who were already committed.
Reversing the Cascade
The fix started with the strategy statement above and followed the same sequence in reverse. Redefine the market to include the 92% of agents who had never purchased. Segment the full base by behavior, volume, and purchase trigger. Map each segment to the root causes blocking its adoption. Design a tailored strategy per segment: a $99 COGS-positive trial for acquisition, subscription rebates tied to 85% activation for solo buyers, pooled credits with team governance for mid-size, and a Deal Desk Give-Get matrix for enterprise.
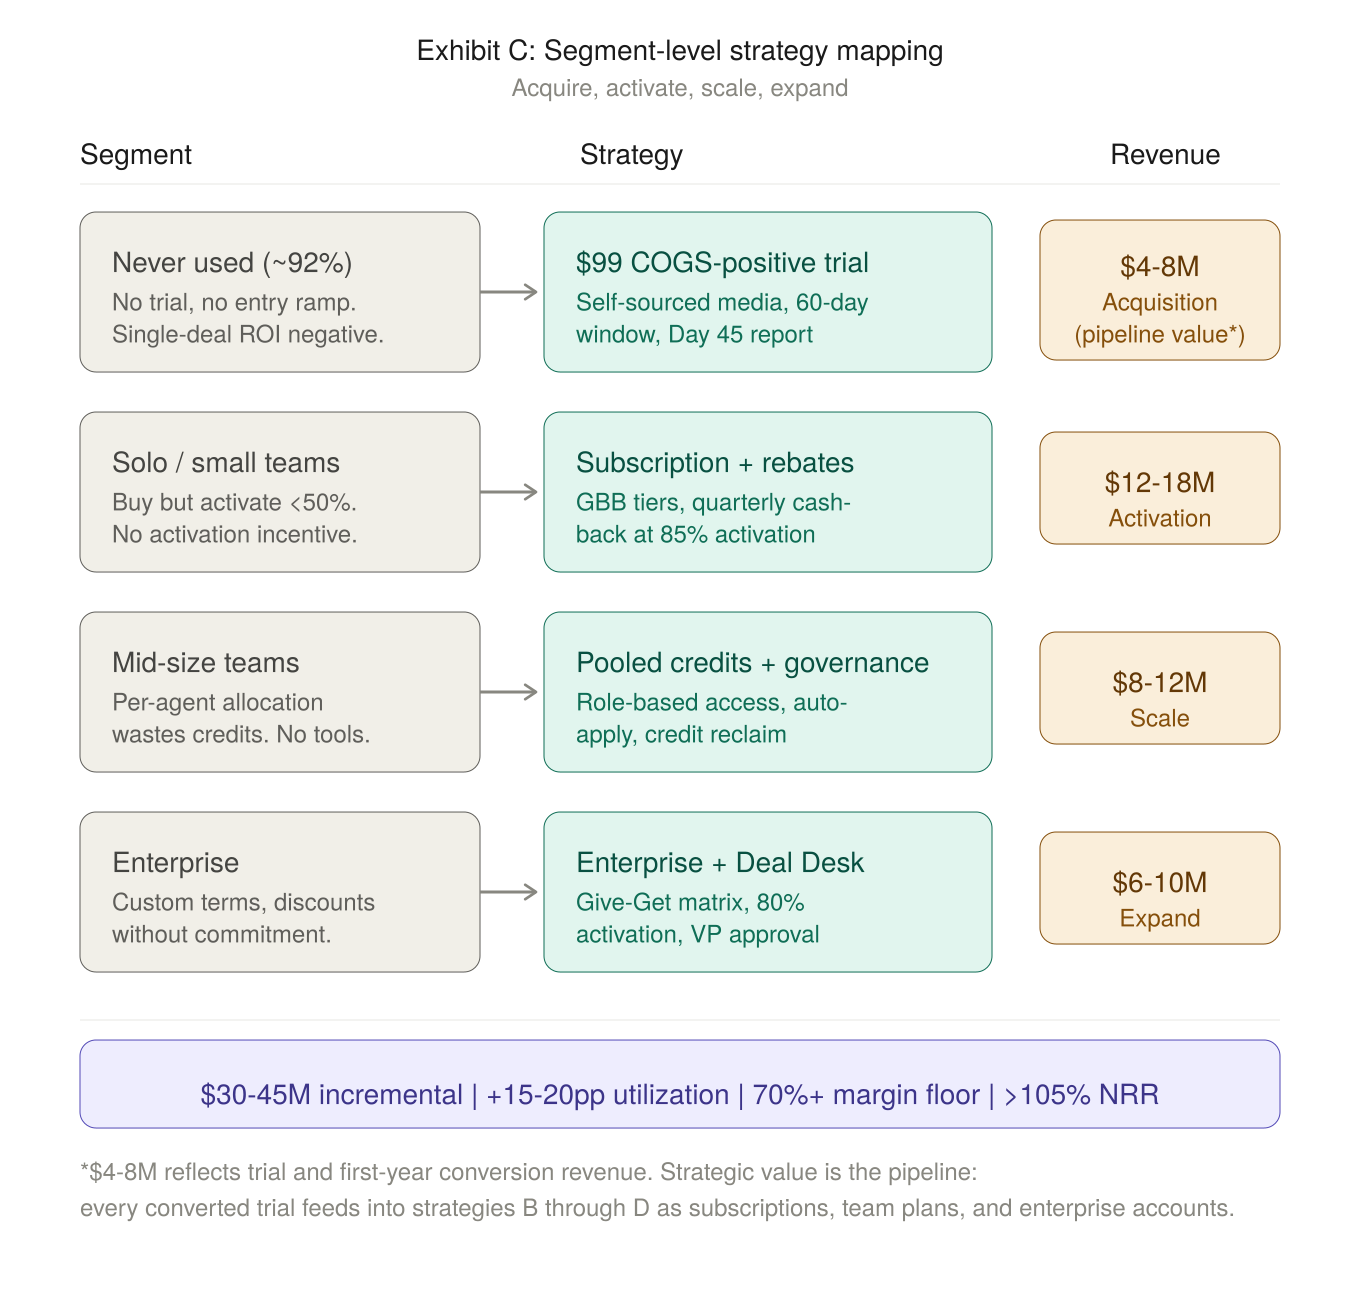
Unbundle the monolithic product into Good-Better-Best membership tiers, each feature-gated so users pay for what they value and upgrade as their needs grow. Validate tier pricing through willingness-to-pay research before setting a single price point. Build the metering, governance, and enablement infrastructure to execute it in the field.
The resulting tier architecture is shown below.
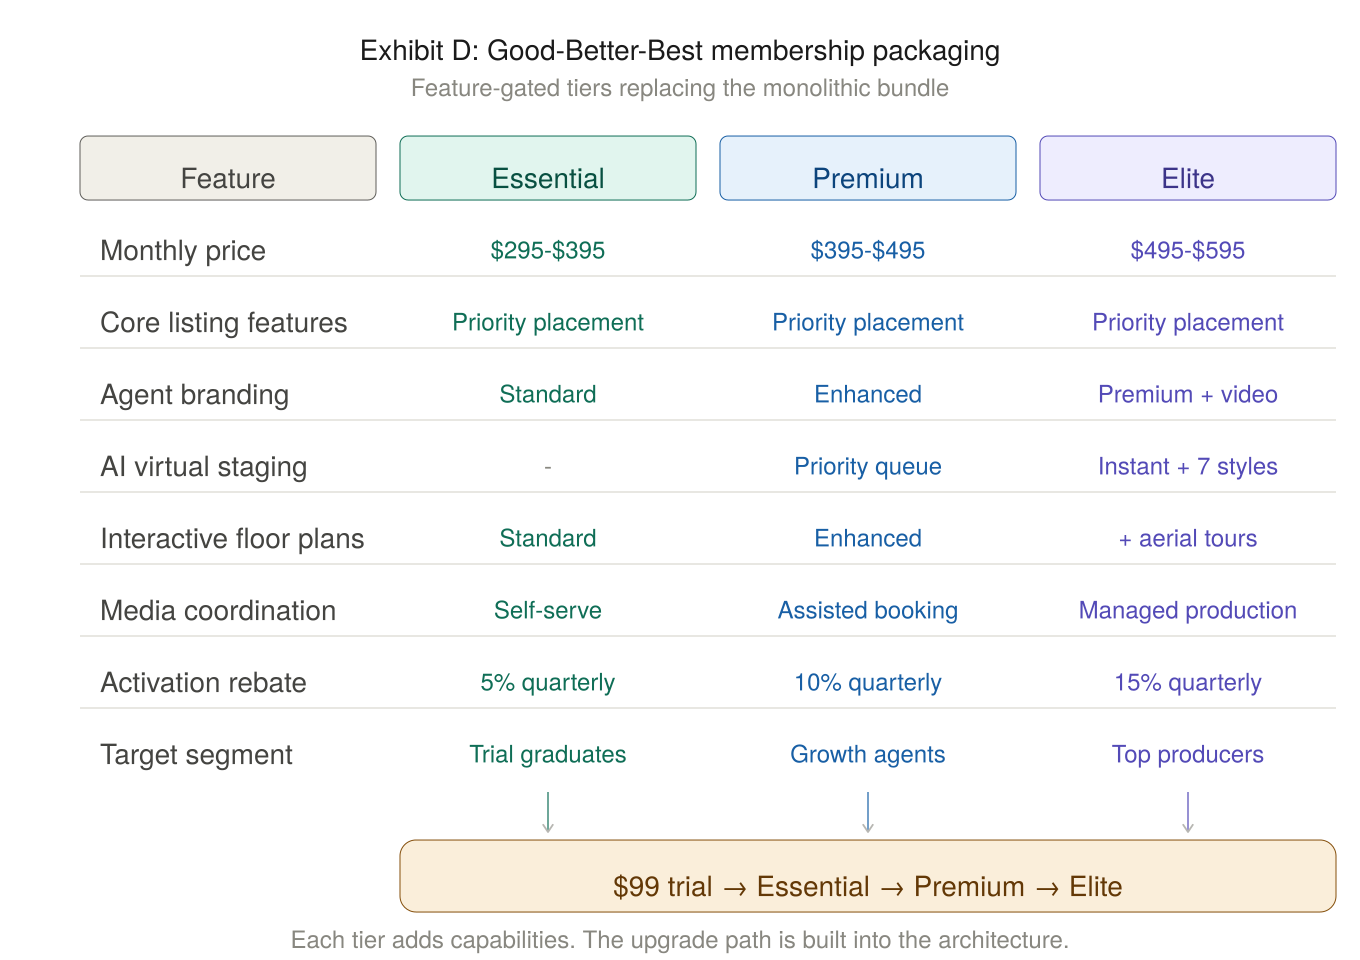
Each segment maps to a specific strategy with independent revenue impact.
The $4–8M trial revenue reflects first-year conversion value. The strategic value is the pipeline: every converted trial feeds into the subscription, team, and enterprise strategies downstream, where the bulk of the $30–45M incremental revenue is realized.
Expected outcome: $30–45M incremental revenue against a ~$200M base, 15–20pp utilization lift, NRR above 105%, and a non-negotiable 70%+ margin floor across every strategy. Each strategy deployed independently so the failure of one would not compromise the others.
The Lesson
Every miss in this cascade was a consequence of the one before it. Define the market too narrowly and you validate PMF against the wrong slice. Validate against the wrong slice and you never segment. Skip segmentation and you have no segment-level strategy. Skip strategy and you have no root cause mapping. Skip root cause mapping and your incentives reward the wrong behavior. And if your packaging and metering were never informed by willingness-to-pay research in the first place, you're optimizing a commercial model that was built on assumptions about 8% of your customers.
The utilization gap on this platform's premium product was 30 percentage points. But the gap didn't originate at the price level. It started with how the market was defined and how the product was bundled. Everything else followed. The cascade explains why these misses happened. But any one of them can be audited and corrected independently. You don't need to start at Miss 1 to start recovering margin.
Download the companion slide deck with the cascade framework, root cause mapping, and segment-level strategy visuals.
Download PDF →
Massoud Ashrafi is the founder of Ashrafi Consulting, where he advises PE-backed and growth-stage companies on pricing architecture, monetization strategy, and commercial governance. He previously held senior pricing and product leadership roles at Amazon, Twilio, GoDaddy, and PwC.
Sources
Diagnostic findings, segmentation framework, tier architecture, and strategic recommendations referenced in this article are drawn from a pricing architecture engagement conducted by Ashrafi Consulting for a major digital real estate platform (2026). Specific proprietary details have been generalized where necessary.
If your utilization gap traces back further than you think, we should talk.
Request a Diagnostic →